Whisky Fringe Tasting Tracker gets a new name – dramtracker.com

The Whisky Fringe Tasting Tracker will be running again this year, hopefully much better on some mobile devices where it was sluggish and tricky to use last year.

And to celebrate, it’s moving from its old location to http://dramtracker.com. Your old user accounts should continue to work, and all your old tasting scores and notes are still accessible – just pull down the ‘year’ list and choose 2012 to see your scores from last year.

The set of whiskies is still identical to last year for testing purposes until the full programme is released. Sláinte!

Getting Newtonsoft Json.NET to respect the DataMember Name property

Json.NET is brilliant, not least because it produces much more sensible JSON in a number of situations than the DataContractJsonSerializer but also because there aren’t many problems that can’t be solved by adding appropriate attributes or formatters.

Sometimes you need to output specific names for enumeration members – in most cases the enumeration member name itself, and Json.NET comes with the StringEnumConverter for this purpose and it works well – just decorate the enumeration itself with the JsonConverter attribute and you’re done.

In some cases though you need to output values that wouldn’t otherwise be valid C# identifiers – for example, the string ‘A128CBC-HS256’ for an enumeration member ‘A128CBC_HS256’ (where we want that underscore turned into a dash). Adding DataMember attributes to the enumeration members doesn’t work, so I threw the following together quickly to respect them where present.

Presented as-is and without much testing – in particular there’ll be a performance hit for this as we’re using reflection to render and parse the values.

Example enumeration:

[DataContract]
[JsonConverter(typeof(DataMemberAwareEnumJsonConverter))]
public enum EncryptionMethod
{
  [DataMember(Name = "A128CBC-HS256")]
  A128CBC_HS256,
  [DataMember(Name = "A256CBC-HS512")]
  A256CBC_HS512
}


Improving the Whisky Fringe Tasting Tracker UI

I’ve got a few modest goals for this year’s Whisky Fringe Tasting Tracker that almost all stem from lessons learned last year and feedback received.

Reducing busyness of the UI

The Tasting Tracker is a single, long list of all of the drams available for sampling – tapping a dram line-item expands out your tasting notes and scoring information for the dram. Finding your dram in the list can be tricky, though, as we show both dram name and distillery/bottler with the same level of UI precedence).

The old dram list (left) showed distillery name at the same scale as the dram name

The old dram list (left) showed distillery name at the same scale as the dram name

This has been changed so that the distillery name is a small, grey subtitle under the dram name making the dram names stand out much more and lightening the UI.

Page size and rendering speed

Expanding the scoring and note controls is a slow operation for a number of reasons:

  • We’re generating HTML for editing controls for each of the 250+ drams to be sampled, even though you’ll only ever see one at a time
  • Tapping expands out the section, causing a reflow of the document – slow anyway, but even slower on mobile devices
  • The sheer volume of HTML being sent to the device makes the DOM very large, slow to manipulate and style

To improve this, I’ve moved the expanding scoring section to instead be a modal popup:

Scoring and tasting notes now appear as a modal dialog, reducing the amount of reflow and simplifying the DOM

Scoring and tasting notes now appear as a modal dialog, reducing the amount of reflow and simplifying the DOM

Not only does it let us show the scoring and note sections without being quite so cramped, it also means that the editing controls are only output in the markup once, simplifying the DOM and the volume of HTML sent to the browser. In fact – just this reduces the volume of markup on the main dram-list for logged in users to just 35% of what it was before.

  • Before: 386KB, 19.7KB compressed
  • After: 134KB, 12.2KB compressed (34.7% of previous uncompressed volume)

While this has negligible impact on the actual number of bytes sent to the device (as compression is employed), it has a noticeable on-device impact in terms of responsiveness which I hope to quantify shortly.

Next steps

There’re a few big-ticket items left on my list:

  • Simplifying account creation and sign-in
  • Supporting some manner of offline mode + sync in case data drops-out during the event
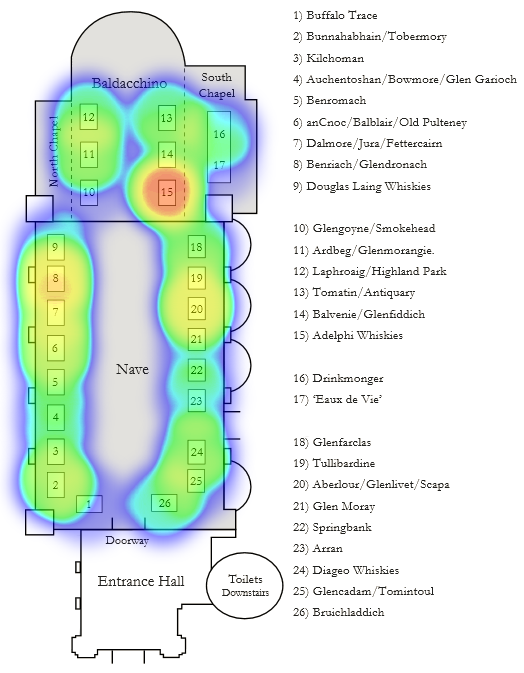
  • Introducing live sampling heatmaps

There’s also more work to be done on making the site much quicker to navigate and manipulate – hopefully making it as quick to use as pen-and-paper.

Use the Windows Azure Event Log to diagnose cycling instances

I recently had a deployment issue where a push of new code caused a worker role to continually restart – everything worked locally, but the thing just wouldn’t stay up in the cloud.

A cleaner event log for diagnosing role-start issues

A cleaner event log for diagnosing role-start issues

The ability to remote into an instance is invaluable for diagnosing this sort of thing, especially when your instance is falling down before it even runs your start-up code. In my instance, the Application event log was filling up with error entries at a rate of 4 a second, all tied back to the Windows Azure Caching Client installer. That didn’t make any sense – the thing hadn’t changed for months. With so many log entries it was hard to tell what was happening.

However, the Windows Azure event log under Applications and Services Logs was much more helpful. It seemed that the role was restarting due to a version conflict of the New Relic monitoring agent – nothing to do with the Caching Client installer. Perhaps the caching client installer was being kicked off by the role starting, and so by terminating it was killing the child process leading to normal Application log entries?

Regardless – it set me down the right path of fixing the dodgy reference and redeploying – making the instance stable at the same time.

Web Platform Installer – ‘The Process Terminated Unexpectedly’

I recently wanted to install the Windows Azure SDK 2.0 on my development laptop, but the usually-pretty-good Web Platform Installer was having none of it:

Well... that's unhelpful

Well… that’s unhelpful

Luckily WPI gives us a log file during installation that might help. Taking a quick shufty, we find where the problem is pretty quickly:

DownloadManager Information: 0 : Starting EXE command for product 'Windows Azure Emulator - 2.0'. Commandline is: '[removed for brevity]\WindowsAzureEmulator-x64.exe /quiet /norestart /msicl RUNDSINIT=1 /log C:\Users\<Username>\AppData\Local\Temp;C:\Qt\Qt5.0.2\5.0.2\msvc2012_64\bin\WindowsAzureEmulator_2_0.txt'. Process Id: 5264
DownloadManager Information: 0 : Install exit code for product 'Windows Azure Emulator - 2.0' is '1622'

So – the process is exiting with code 1622, but hold on – what the hell’s that log path? It starts looking like a reference to the temp directory, but with the Qt install path involved? Let’s look at what %TEMP%’s set to:

C:\Users\<Username>>echo %TEMP%
C:\Users\<Username>\AppData\Local\Temp;C:\Qt\Qt5.0.2\5.0.2\msvc2012_64\bin

As they say – there’s your problem. Removing Qt from the %TEMP% environment variable and we’re off.

Hottest stands at the RMW Whisky Fringe 2012

While I’m not sure if I’m going to re-run the Whisky Fringe Tasting Tracker from last year, I saw heatmap.js for the first time the other day and thought it’d be fun to make a Mansfield Traquair heatmap showing dram-sampling by stand. Here’s the result:

Heatmap of drams sampled during the 2012 RMW Whisky Fringe

The 675 samplings recorded by www.wf2012.co.uk over the 2012 Whisky Fringe

Not bad for a first attempt. That’s 675 samplings tracked by stand – of course, some stands had appreciably more drams to sample than others but there were definite hotspots. Given that we have opinion data too, we can also plot the hotspots of most-liked drams:

Positive opinions recorded at each stand during the 2012 Whisky Fringe

Positive opinions recorded at each stand during the 2012 Whisky Fringe – broadly similar but with some interesting detail

If I do run it again this year it’d be great to get heatmap.js combined with the above floorplan image and Pusher for some real-time updates…

Resizing images in Windows Azure

Sometimes you come across relatively simple operations that work locally but fail in the cloud – notably, anything that involves image manipulation using the System.Drawing namespace is unlikely to work.

When faced with this sort of thing, WPF immediately springs to mind and luckily this post from Dr WPF gives a sample that works both locally and in the cloud – jackpot!

Windows Azure: ‘Roles instances are taking longer than expected to start’

New caching doesn't seem to be a productivity improvement

New caching doesn’t seem to be a productivity improvement

I’ve experience the above plenty of times – hit F5, wait for your projects to build then sit back and enjoy anywhere from a minute to five minutes of peaceful reflection while the Azure emulator gets up to speed.

After some playing with procmon I discovered that the vast majority of activity in those interminable minutes could be put into three broad buckets:

  • Logging to DFAgent.log, sometimes tens of times a second (something I’m seriously considering symlinking to NUL, or at the very least a ramdisk)
  • Various things to do with installing the Windows Azure Cache Emulator
  • Lots of communications with ‘something cloudy’ at 168.63.0.*

Troubles seemed to start with the install of the 1.8 SDK, but in fact appear now to be linked to whether or not ‘Enable Caching’ is turned on in the cloud role properties:

j'accuse!

j’accuse!

Some timings from my machine on a particularly large solution, from ‘Starting emulator’ to a usable deployment:

  • Enable Caching ‘On’: ~3 minutes average
  • Enable Caching ‘Off’: ~15 seconds average

This is a bugger though, as you can’t have cloud-configuration-specific settings for your caching – it’s either globally on or globally off. In addition, without caching enabled anything that attempts to use it will fail with an exception (fine, if those classes fall back to a null cache implementation). So – for my purposes, my local development environment setup changes from:

  • Caching enabled
  • Use Azure caching for session state management

to a new cloud project specifically for development with:

  • Caching disabled
  • Use the Session State service for session state management (configured in web.config) and web.config transforms to convert to Azure Caching session state management for deployment

And my F5 experience goes from three to five minutes down to 15-20 seconds. Not ideal, as I’ve taken my development environment another step further away from my deployment environment, but from a productivity point of view it’s a no-brainer.

Have yet to diagnose why installing the Windows Azure Cloud Cache components as happens during a development run is so costly – more investigation required…

Proxying Microsoft.WindowsAzure.Storage.Table.CloudTable

The Windows Azure SDK’s pretty good, but implementation decisions in sections of it can make extending or monitoring what it’s up to tricky. Recently I wanted just to track the number of reads and writes that were taking place on a set of tables per request to identify opportunities for caching.

Given I was using a repository pattern, I was able to proxy the CloudTable object upon which queries are executed. While the proxy doesn’t inherit from CloudTable (not least because it’s sealed), with only a couple of lines replaced all code that called methods upon an instance of CloudTable were quickly calling the equivalent methods on my proxy. It’s not perfect, but now that it’s in place I can do a number of fun things like track table storage operation counts, or implement access control per table.

To save anyone else having to write it, it’s presented below:

Windows Azure cache client crashing when developing locally? Check your system time

While trying to diagnose a time-zone issue in an Azure application, I lazily changed my system clock to be an hour earlier instead of actually changing my system timezone. I then found I couldn’t start my app in the emulator:

CacheInstaller.exe has stopped working? Check your system time

CacheInstaller.exe has stopped working? Check your system time

If your system clock is out by more than about 10 minutes and you’re trying to use the Azure cache for development purposes then you’re going to have some trouble.

Remember – having your system time right doesn’t just mean setting it up to look right on the clock in the taskbar, you also need to be in the right timezone so that calculations to and from UTC are performed correctly.