


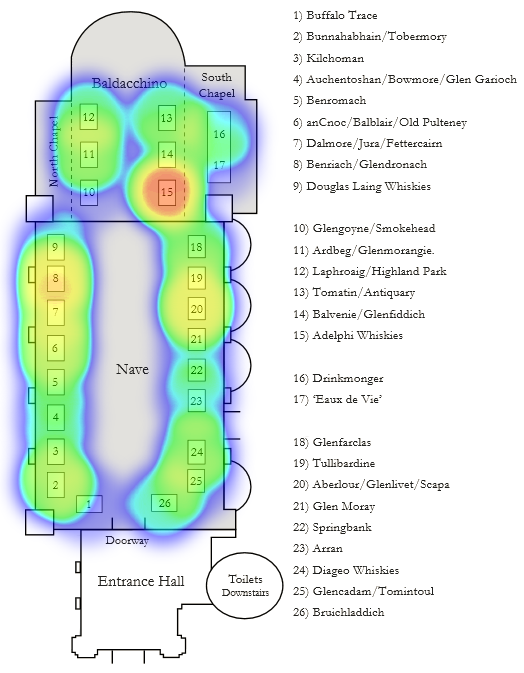
While I’m not sure if I’m going to re-run the Whisky Fringe Tasting Tracker from last year, I saw heatmap.js for the first time the other day and thought it’d be fun to make a Mansfield Traquair heatmap showing dram-sampling by stand. Here’s the result:

The 675 samplings recorded by www.wf2012.co.uk over the 2012 Whisky Fringe
Not bad for a first attempt. That’s 675 samplings tracked by stand – of course, some stands had appreciably more drams to sample than others but there were definite hotspots. Given that we have opinion data too, we can also plot the hotspots of most-liked drams:
Positive opinions recorded at each stand during the 2012 Whisky Fringe – broadly similar but with some interesting detail
If I do run it again this year it’d be great to get heatmap.js combined with the above floorplan image and Pusher for some real-time updates…
Just stumbled upon this post the other day, loving the heat maps and the tracker!
Did you manage to procure tickets for this years event and are you running the tracker again?
good job,
DM.
Thanks, glad you like it!
Am planning on running the tracker this year, trying to make a few changes to it to make it less sluggish to navigate on mobile phones. Need to think of a more future-proof domain than last year’s ‘wf2012.co.uk’ mind…
Excellent. Only just seen your reply! Yep the url is a bit defunct now but nevermind haha.
Looking forward to trying your site out this year. Whilst I’ll still scribble my notes onto my programmes (as I’ve done in recent years), your tool will give me a great way to see everything I’ve tried at a glance, rather than raking through drawers to read what I marked down 6 months later.
Did you post a link on the royal mile whiskies facebook last year at all? It should get you some traffic.